# Ryder Cup 2018 - US wildcards (from the data)
# Aug 30, 2018
With the 2018 Ryder Cup fast approaching, there’s a lot of speculation about the team composition for both sides. Automatic qualification has the following players already making the trip to Le Golf National:
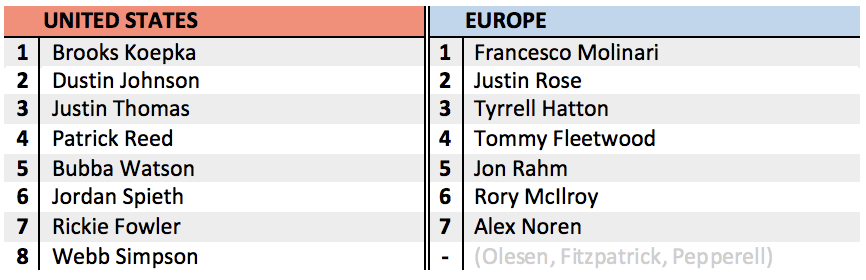
Rankings accurate as of August 30th 2018, ahead of the Dell Technologies C’ship & Made in Denmark
Team Europe still have a few potentials who can join on points for the last spot, with the Made in Denmark event being an opportunity for Thorbjorn Olesen, Matt Fitzpatrick and Eddie Pepperell to claim the 8th jersey.
The US, however, already have their eight guys locked in. All that remains is for Jim Furyk to select his four wildcard picks to complete the team. Everybody has their own take on which guys should be given the nod, and what qualities they possess which make them an ideal selection. Experience and character are both typical considerations when making selections, and the golfing media already have earmarked some marquee players that they believe should be on Furyk’s teamsheet.
It can’t be easy making decisions like this with so many opinions being broadcast. What does the data tell us? We’ll have a deeper look at the form of the top US non-automatics (beyond just the RC points) in this blog post, using a couple of different metrics.
(All Python code available at https://github.com/jsnctl/rydercup2018)
An interesting place to start is by looking at the finishes each week on the PGA Tour this season for US players. If we grab all the final positions for each player that have made at least 10 cuts so far, we can get a crude estimate of their form each week against the field.
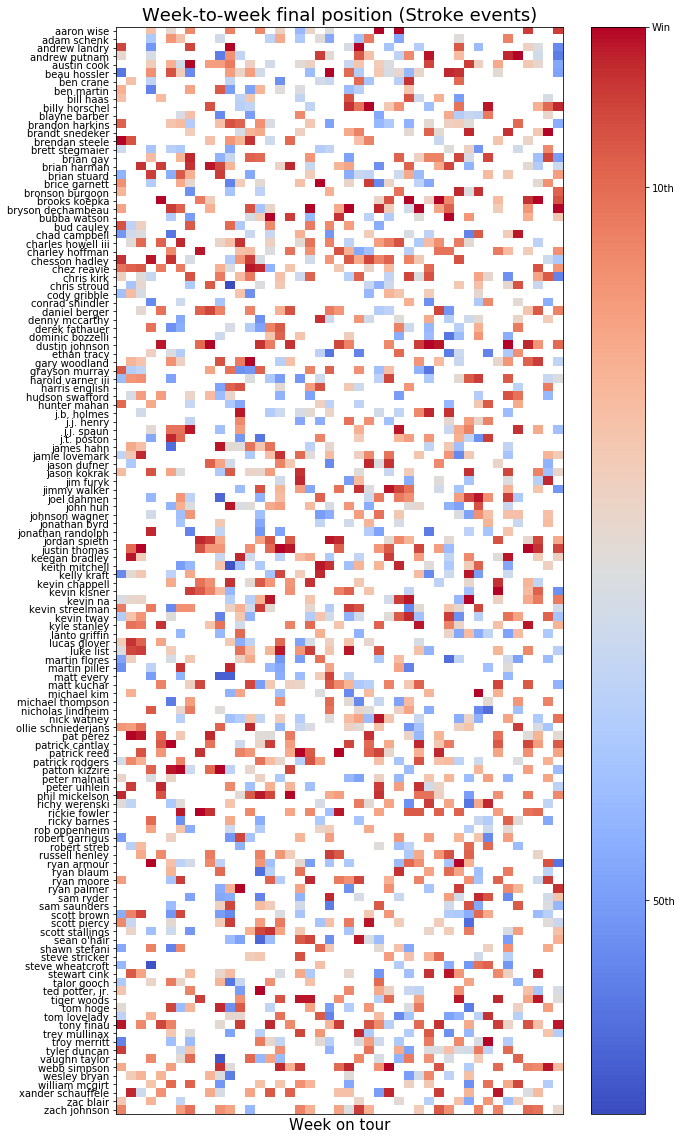
Weekly rank in 2018 for US players making 10 cuts in the regular season (through Northern Trust)
The above illustration encapsulates all that weekly ranking data for each player: white space corresponds to either a missed cut or a skipped event, more blue means a poorer finish whereas more red shows a good result, with the deepest red indicating a win. If we calculate the average rank per week, sort the players by this value and look at the top performers, things get a little clearer:
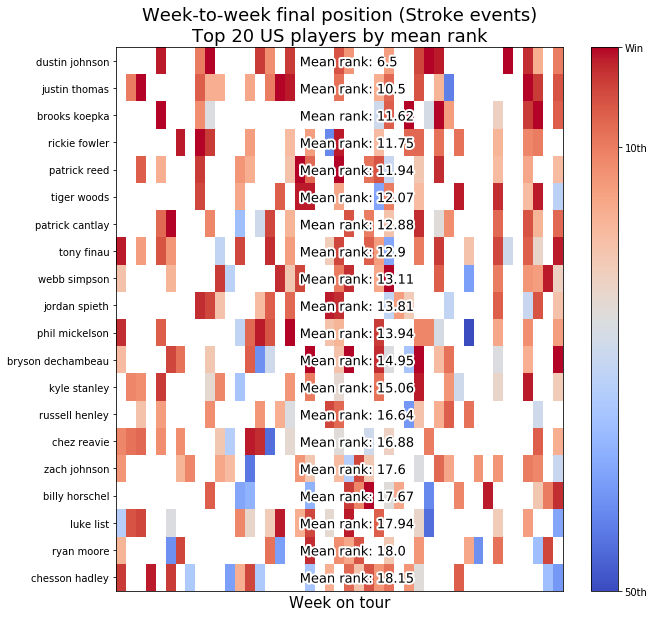
Top 20 US players by mean weekly rank (through Northern Trust)
No big surprises with the best-in-class here, world no.1 Dustin Johnson comes out ahead of the pack with a pretty exceptional mean rank of ~6th. He’s the only player who has an average final position in the top 10 for this season.
The rest of the US auto-qualifiers do pretty well too: everybody is here in the top 20 with the exception of Bubba Watson, who has an average weekly rank ~36th. This is probably down to Bubba’s win at the Dell Technologies Matchplay not being counted in this analysis (sorry Bubba, at least that’s relevant to the Ryder Cup).
The notables from the non-qualifiers are (by mean rank): Tiger Woods (12.07), Patrick Cantlay (12.88), Tony Finau (12.9), Phil Mickelson (13.94) and Bryson DeChambeau (14.95). Tiger’s return is made all the more impressive by this result, averaging well inside a top 15 every time he’s teed it up this season. Along with Phil, you have to expect these guys will be the first two picks for Furyk: all their experience coupled with a good 2018 for both will be invaluable.
For the remaining two slots, let’s continue to look at the front-runners from the analysis so far: Finau, DeChambeau and Cantlay. Since the mean weekly finish doesn’t consider ties or the relative gap in strokes between final positions, let’s look at a different metric to find out some more: relative strokes to the eventual winner. This is a decent approximation of how well the player performed relative to the best player that week.
This is calculated by taking the difference between a player’s four round total and the total of the eventual winner of the event: note that winning an event results in a relative strokes of 0, which is the ideal value.
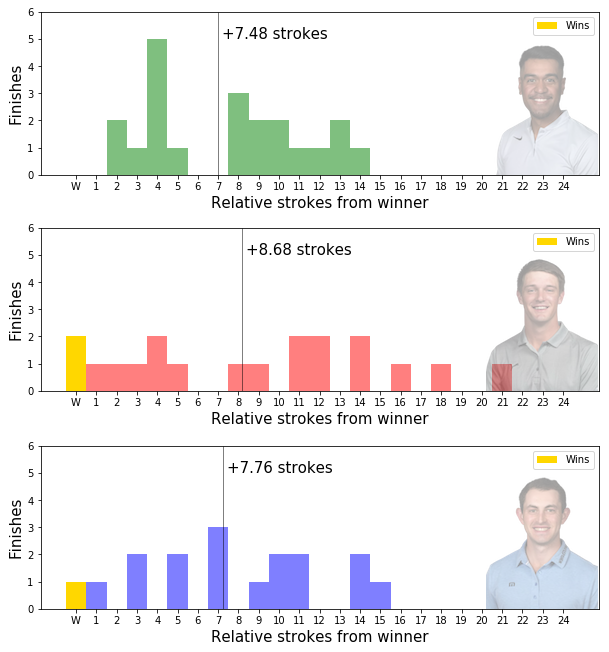
Histograms of relative strokes from winner for Finau, DeChambeau & Cantlay, with average relative strokes annotated
Finau has the lowest average of this measure of the 3, but doesn’t have any wins vs. DeChambeau and Cantlay’s 2 and 1 respectively this season. To put this into perspective, only Dustin Johnson and Justin Thomas come out better than Finau on relative strokes, with +5.31 and +7.33 respectively. Also worth noting that Cantlay is ranked 5th and DeChambeau 9th among the US players on relative strokes.
These three guys are clearly playing well this season, and each of them has a strong case to be a part of the squad. But there’s only two spots remaining.
There’s an enormous volume of statistics and metrics available to quantify golf performance, including specifics of the player’s game. Perhaps we need to start looking at these individual attributes to identify the best two guys for the job. The PGA Tour track everything from driving distance, to strokes gained from approach, to bouncebackability — there’s almost too much to choose from to make a decisive choice. To address this, we construct something known as a feature vector for each player consisting of the following key performance measures (with the intention of covering as many pillars of ‘good play’ as possible):
- Strokes gained: off tee, approach, around the green, putting, tee-to-green, total
- Driving: distance, accuracy
- Percentages: greens in regulation, sand saves
- Averages: eagles (holes per), birdie, scoring
This 13-component vector acts as a performance signature for every player. Using this, we can then begin to directly compare players, measure similarities and cluster similar playing styles together.
Here’s an example of Dustin Johnson’s features prior to processing:
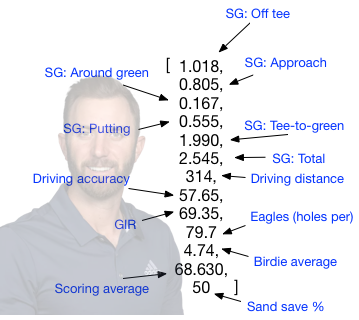
Pre-scaling feature vector for Dustin Johnson
Each of these are scaled relative to the rest of the active players on tour (not just the Americans, as was the case with the previous analyses) in order to make them directly comparable in a global feature space. All this consists of is range normalising the values by subtracting the mean and dividing by the standard deviation from each column.
This creates a less manually interpretable but more statistically robust signature for each player, which allows us to measure distances between each of the features for two given players e.g. who is most alike DJ in driving and putting? There’s a few ways of computing distances in feature space, but we use a technique called cosine similarity (opens new window) to measure how alike two players are. This provides a value in the range [1, -1], with 1 being the maximum similarity and -1 being completely unalike.
If we assume the auto-qualified team members represent the ideal qualities of a US Ryder Cup player, we can build a combination of them by taking the average of their post-processed feature vectors. This acts as a sort of ‘centre of gravity’ for the eight players in the team already, and is an anchor point in the feature vector space around which the team exists. We can have a look at who’s feature vector is most similar to this.
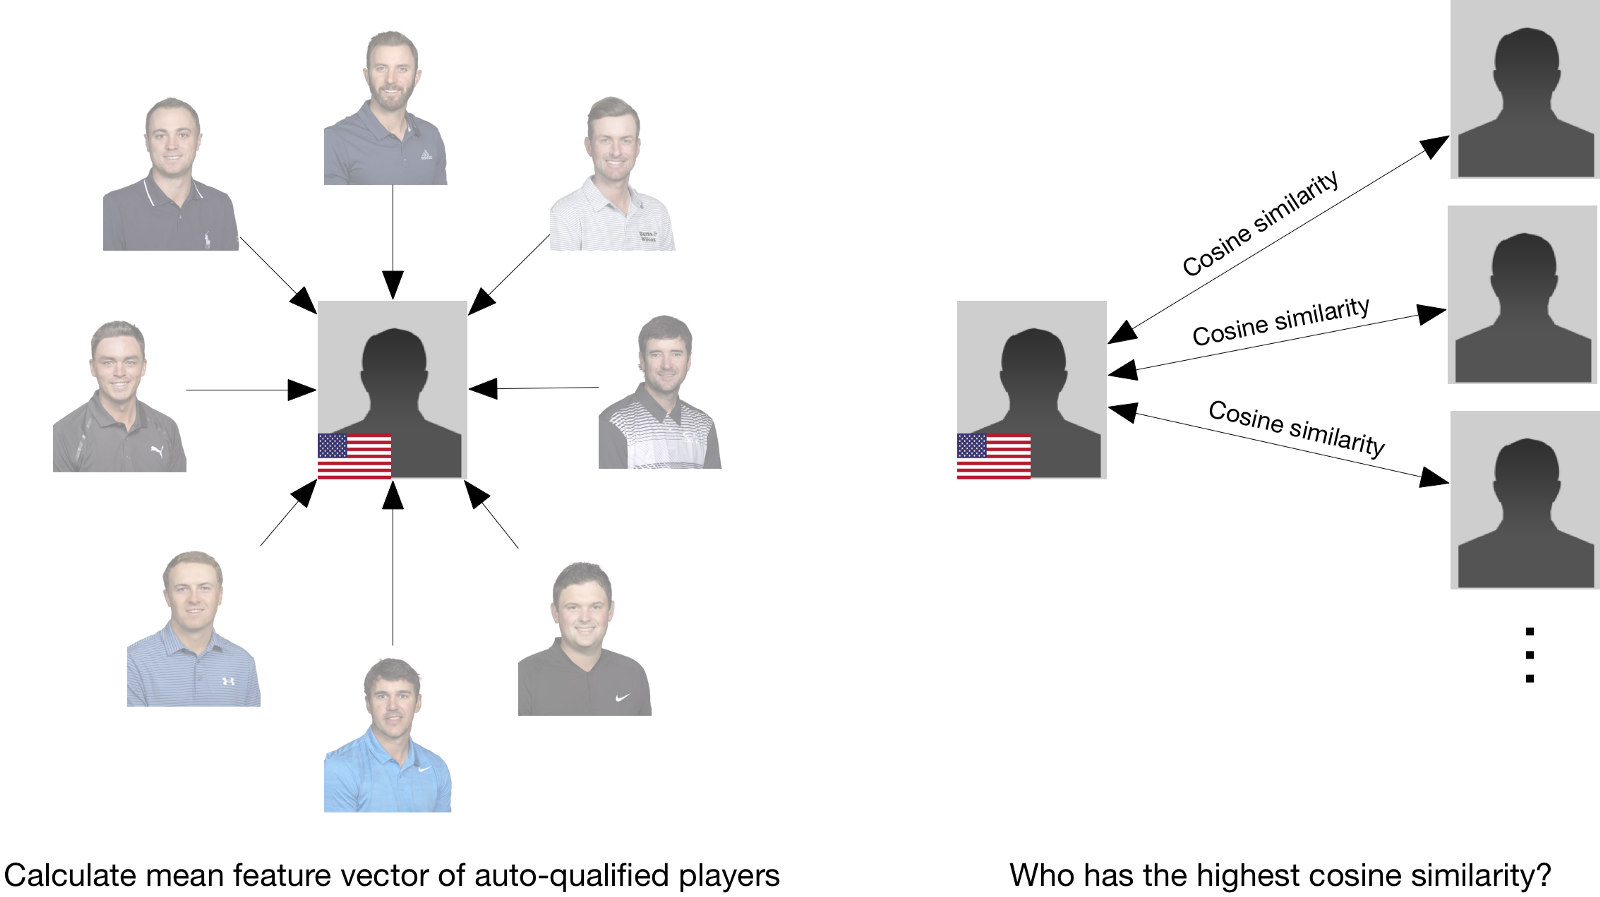
So which of the three candidates is most similar to this ‘ideal US Ryder Cup player’ or ‘US team anchor’? Calculating the cosine similarity across all the non-qualified US players:
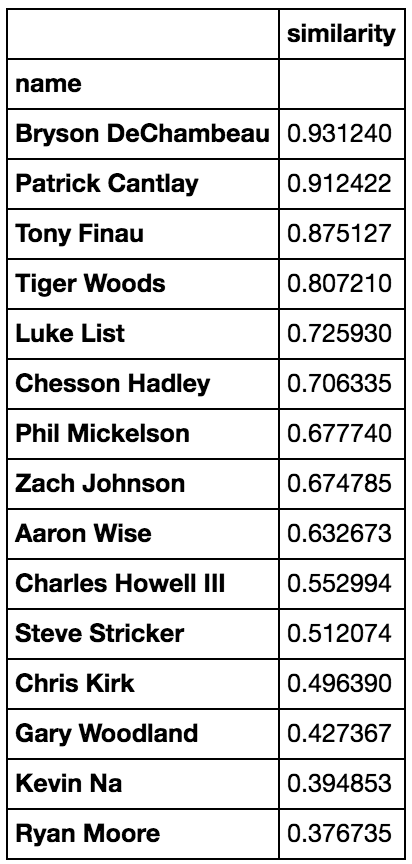
DeChambeau, Cantlay and Finau are all still on top! This is probably unsurprising as good tournament results are built on good play, but note that our feature vector representation doesn’t consider tournament position or strokes to the winner in the same manner as the first two metrics (though strokes gained is definitely related).
From this result, we can conclude that Bryson is statistically the most alike of the non-qualifiers to the auto-qualifiers, and that from the data he’d be a superb addition to the team (no surprises there).
As for Finau vs. Cantlay, that’s a really tough choice. The momentum is probably with Finau with more recent results and in higher profile tour events, but as we’ve seen here Cantlay does have the figures to back it up (and actually out-performs Tony in some aspects).
Best of luck to Jim Furyk with his selections, and to the US. Let’s go Europe!
(Originally published on Medium (opens new window) 30-08-2018)
Acknowledgements
- PGA Tour (opens new window) for all data & player images
- Inspiration from https://github.com/jacoduplessis/golf (opens new window)’s Go PGA Tour API wrapper
- Thanks to Towards Data Science (opens new window) for re-publishing the original Medium blog post